Deep-dive reports and charts
Explore unique charts and selected reports from Silvia Insights.
17 research articles
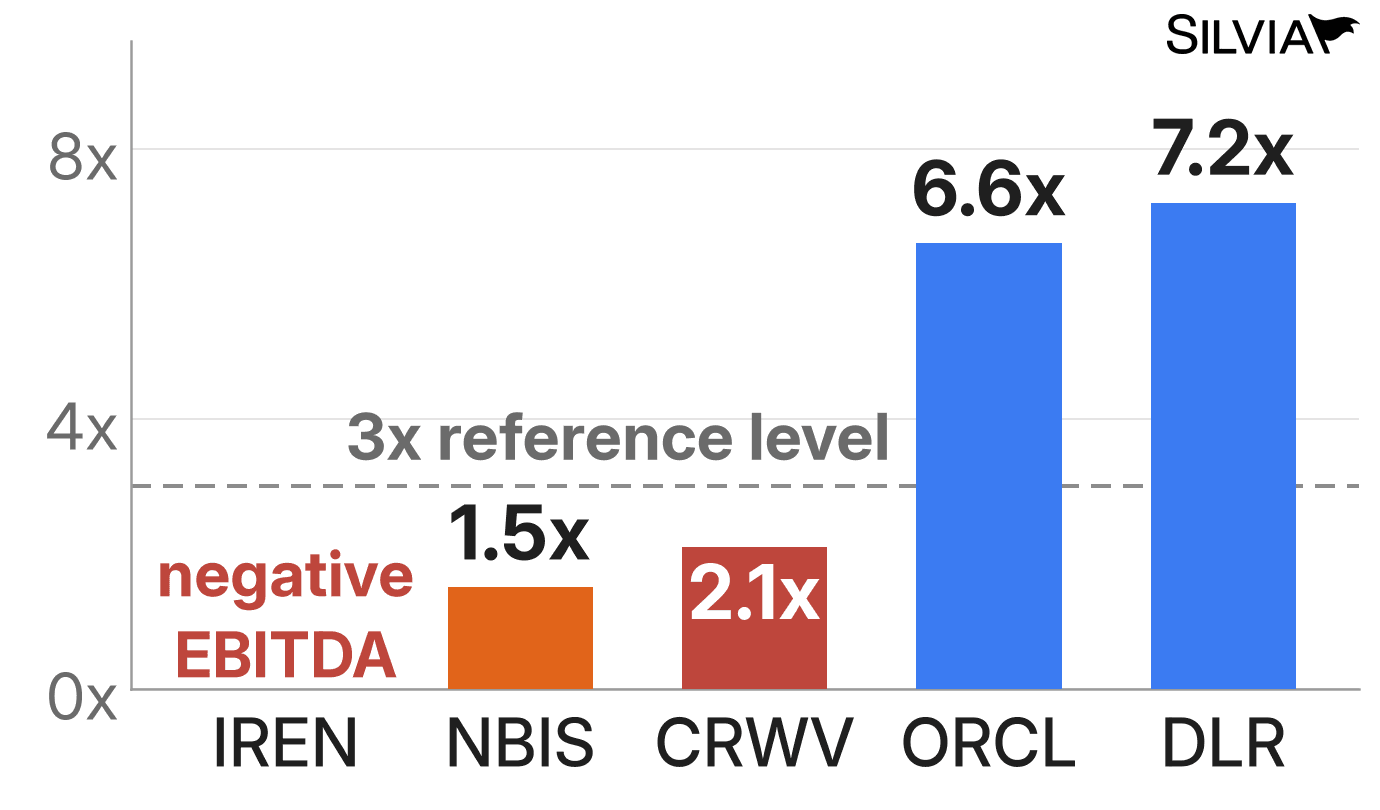
CoreWeave covers its interest bill 2.1 times, while Oracle covers it 6.6 times
Silvia Insights
Daily chart
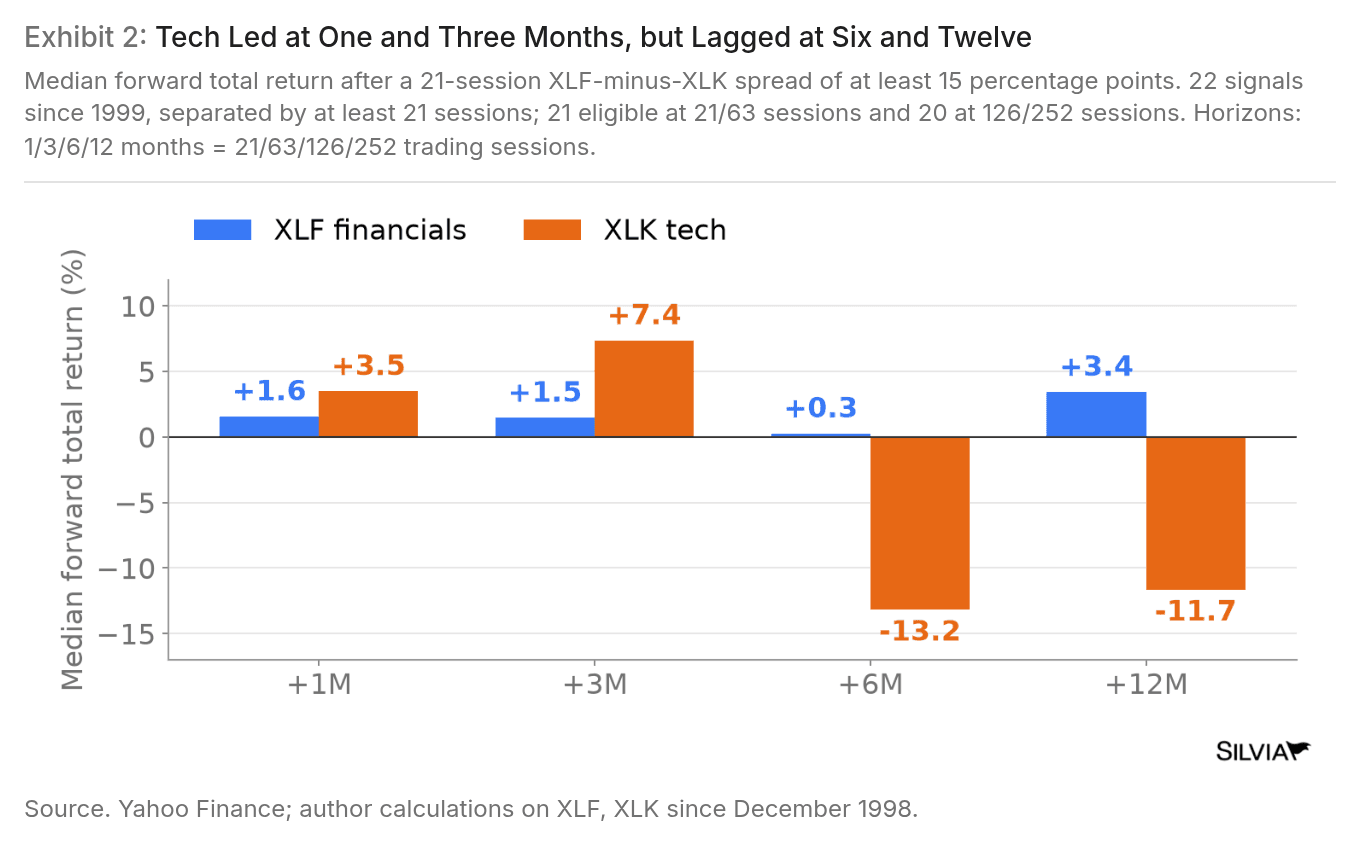
Tech bounced first, then lagged, after financials' past big leads over tech
Silvia Insights
Daily chart
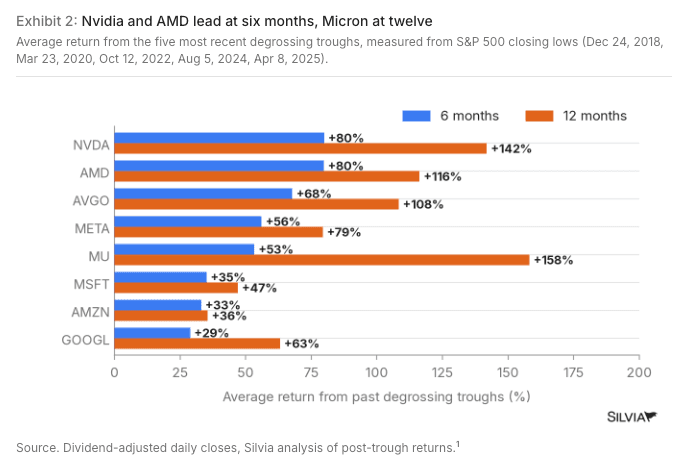
Chip stocks led a year after past selloff lows
Silvia Insights
Daily chart
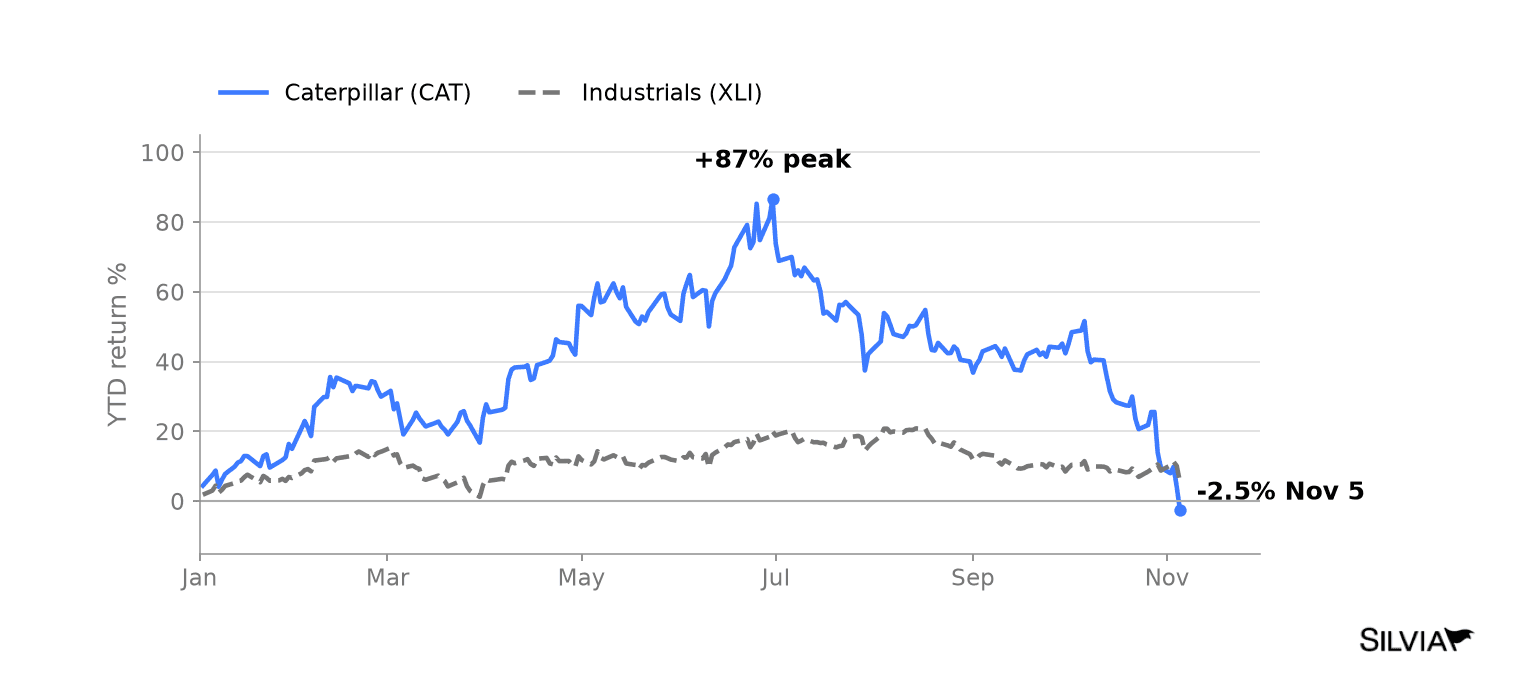
Caterpillar gave back its entire 87% gain
Silvia Insights
Daily chart
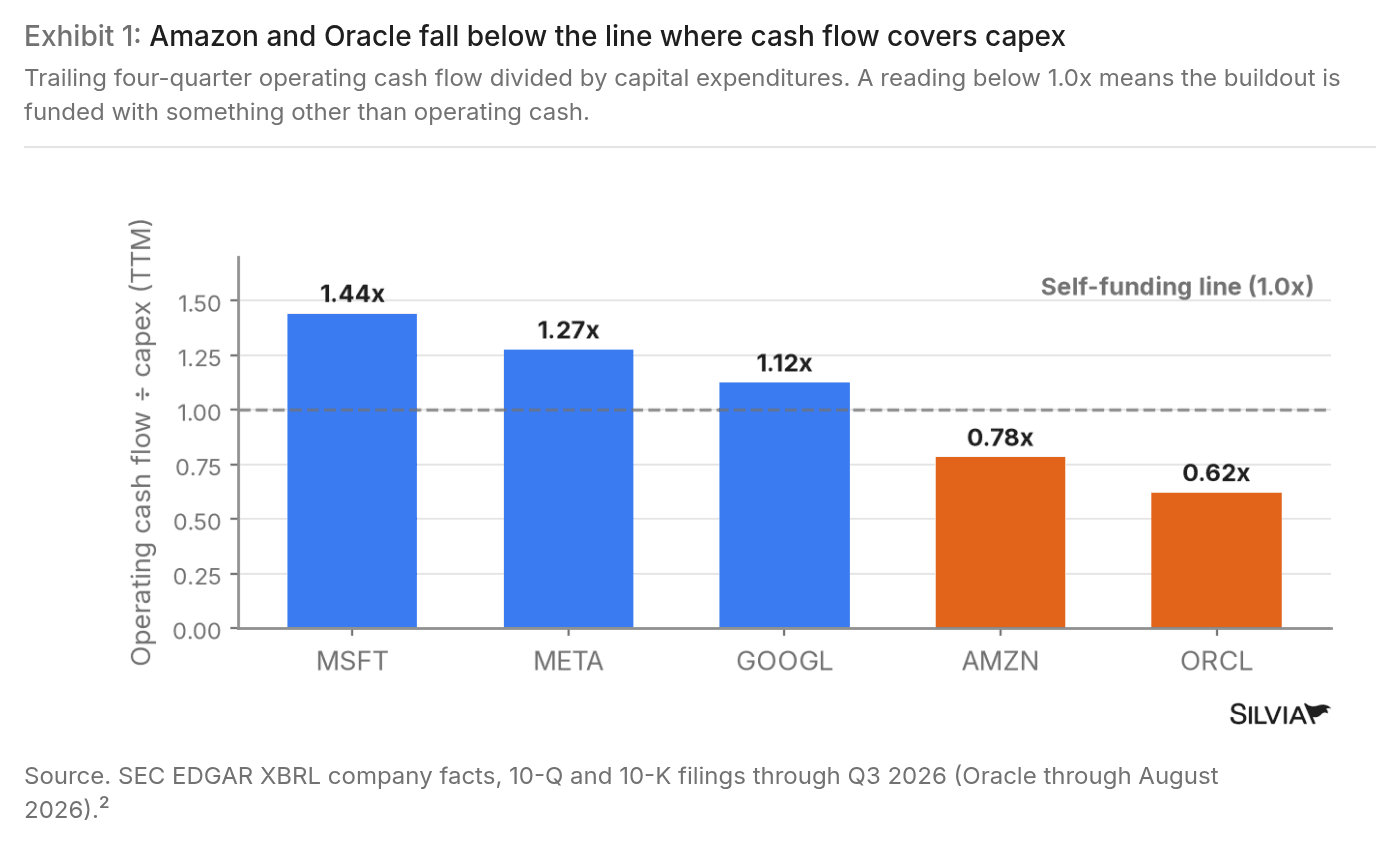
Amazon and Oracle now spend more on data centers than their businesses bring in
Silvia Insights
Daily chart
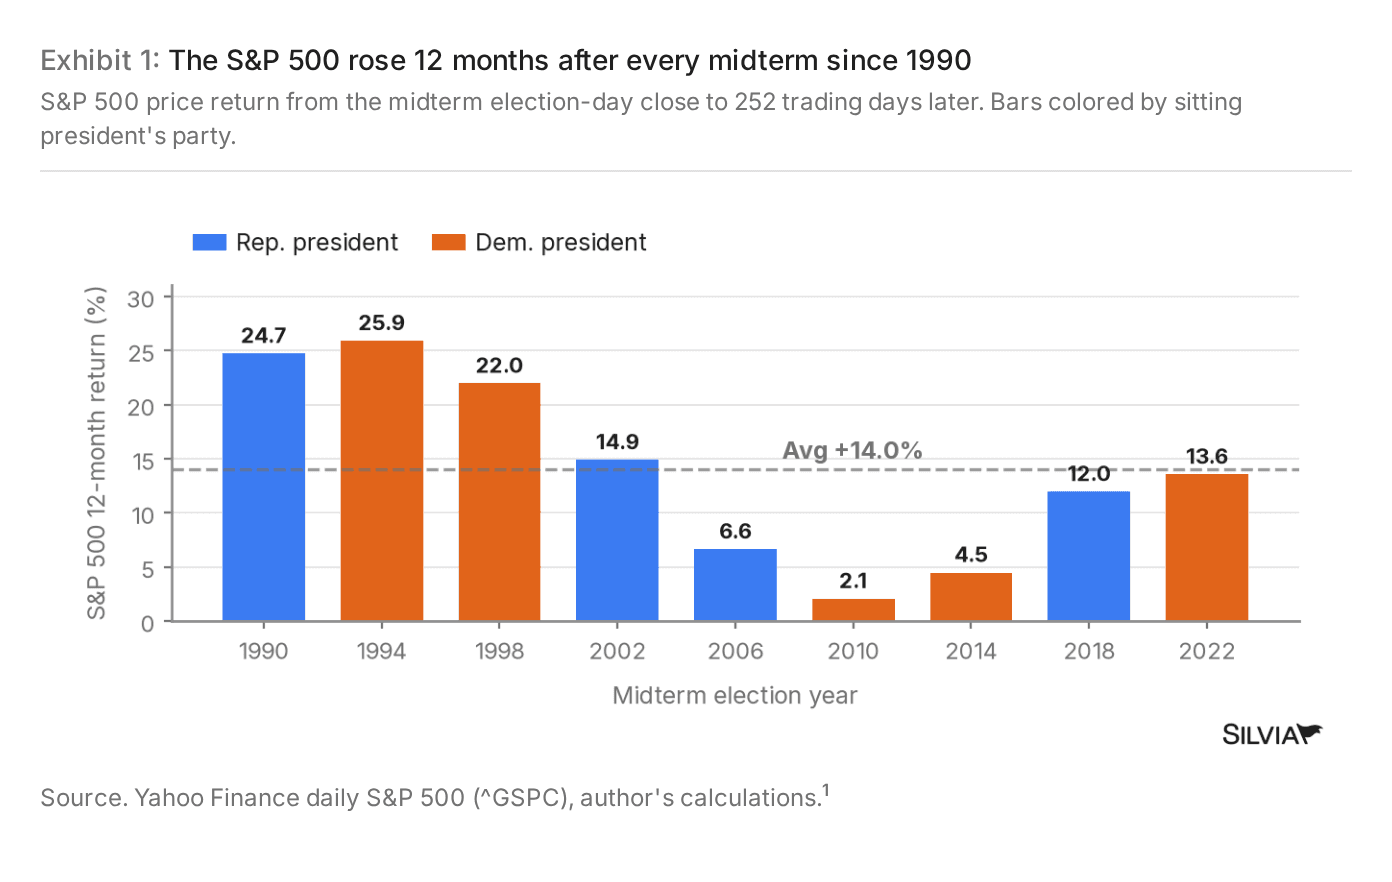
The S&P 500 has been higher a year after every midterm since 1990
Silvia Insights
Daily chart
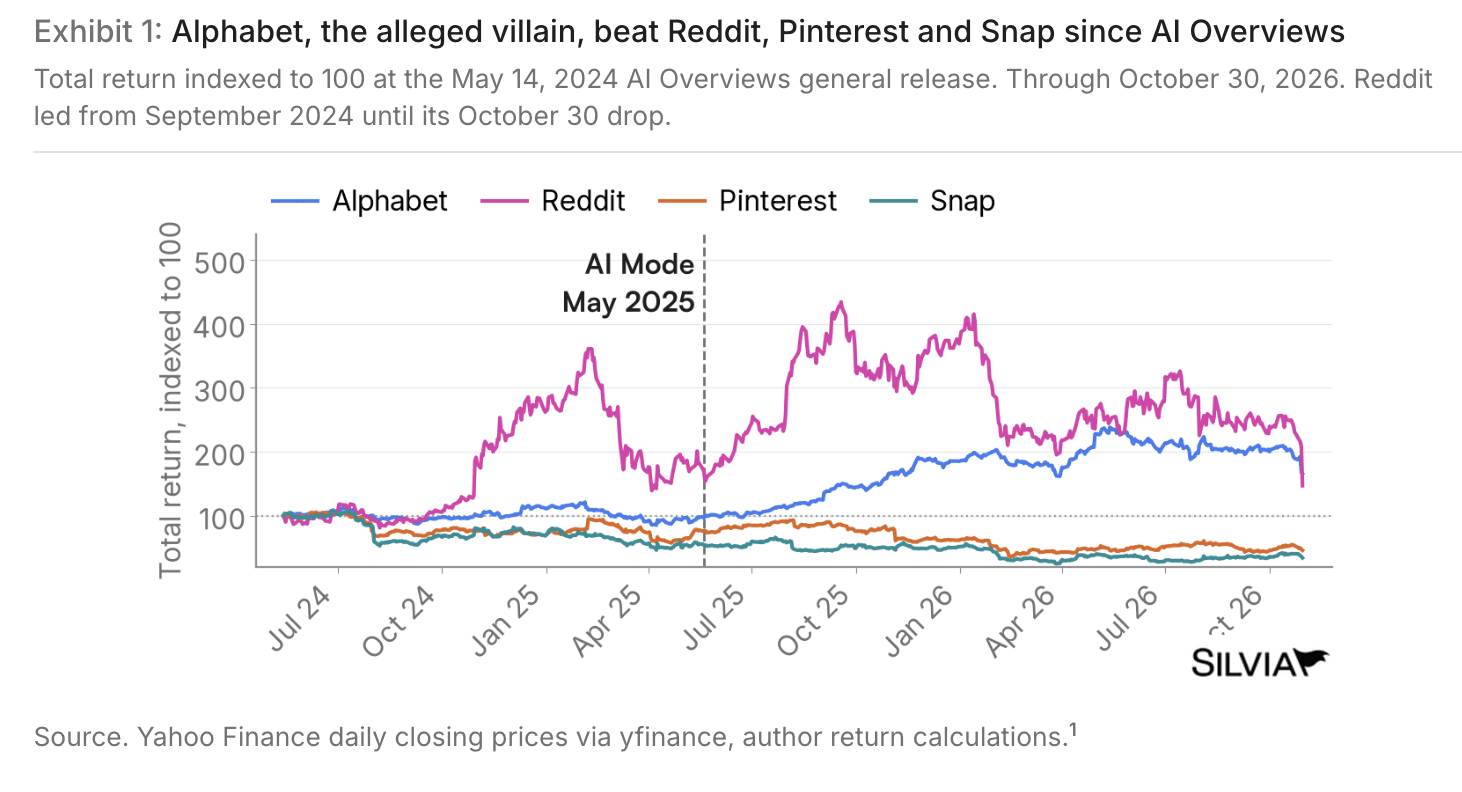
Reddit outran Alphabet for more than two years, then lost the lead in a day
Silvia Insights
Daily chart
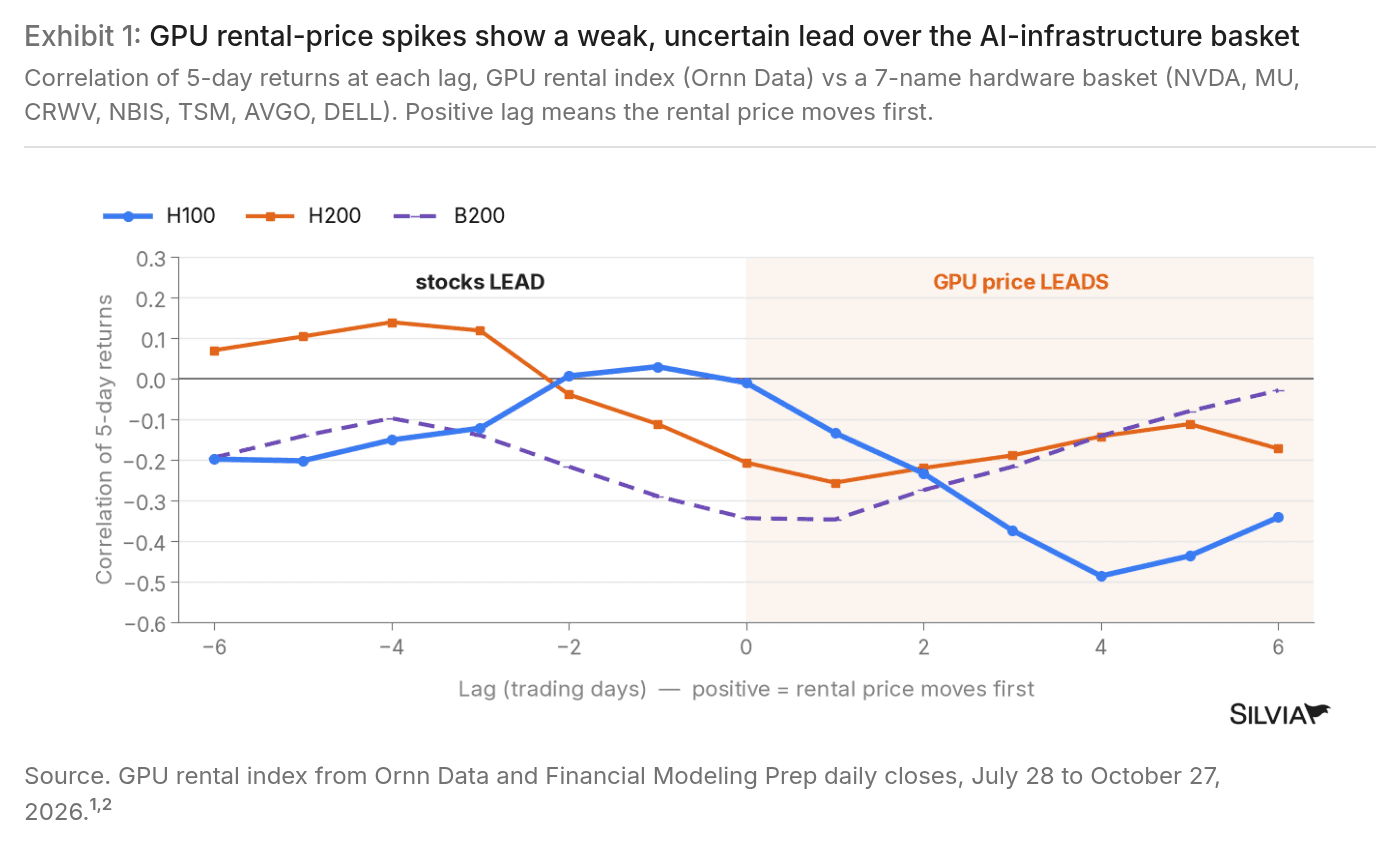
GPU rental spikes came before AI stock dips, but the signal is faint
Silvia Insights
Daily chart
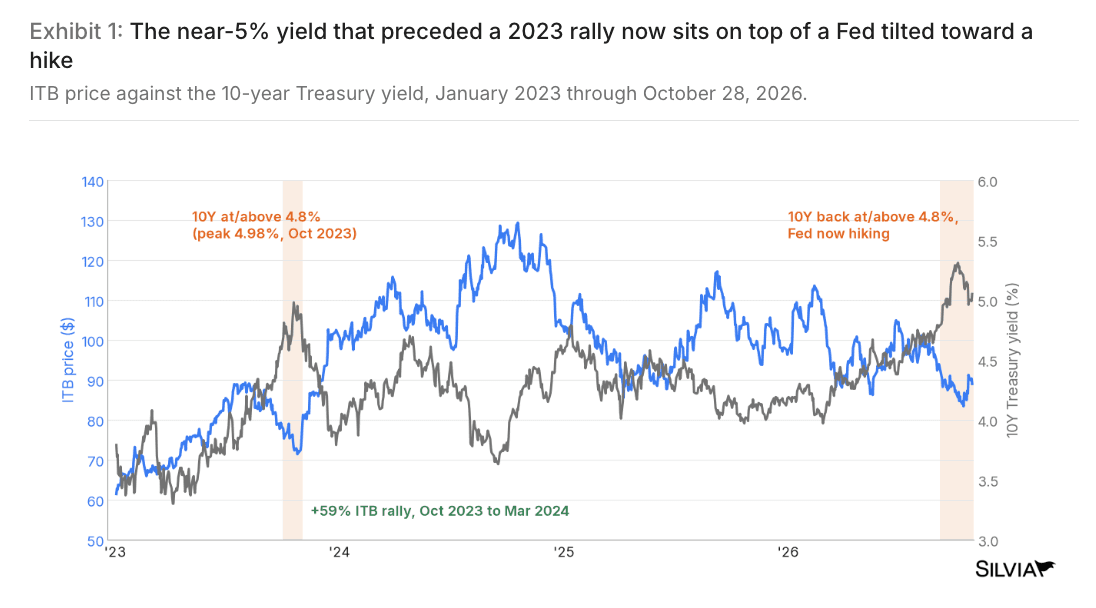
Yields are back near where homebuilders' 59% rally began, but the Fed has flipped
Silvia Insights
Daily chart
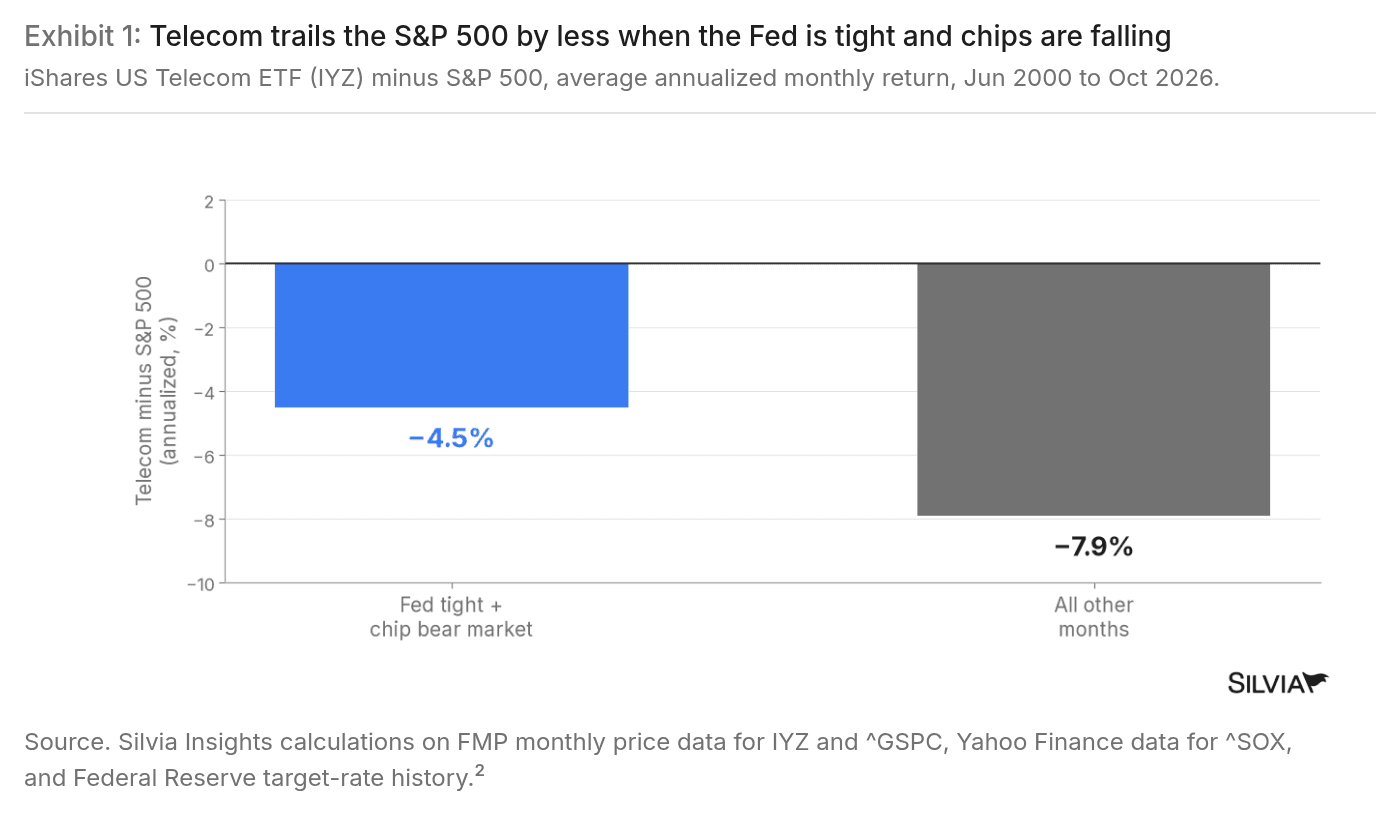
Telecom trailed the S&P 500 by less when the Fed was tight and chips were falling
Silvia Insights
Daily chart
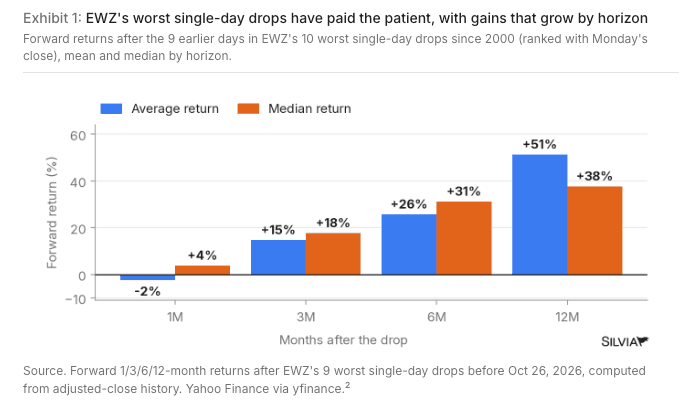
Brazil's worst days have been followed by a 38% median gain a year later
Silvia Insights
Daily chart
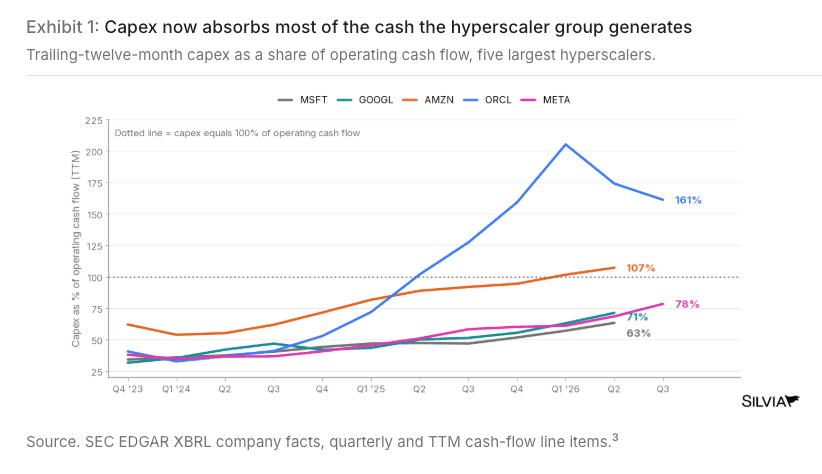
Big Tech now spends 85 cents of every operating cash dollar on capital projects
Silvia Insights
Daily chart
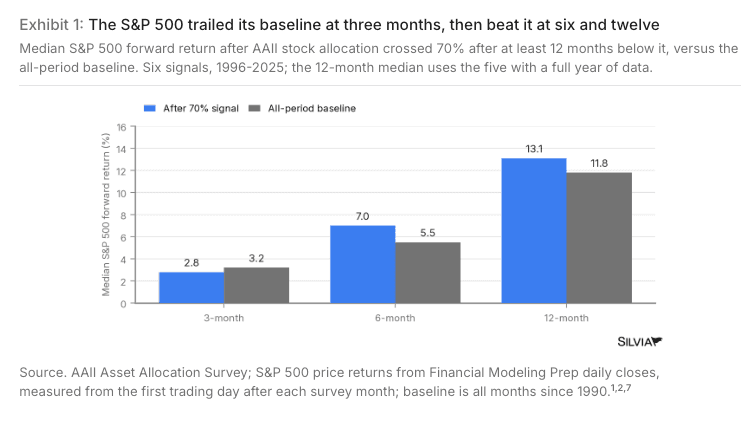
Retail investors are loaded up on stocks. Here's what the S&P 500 did next.
Silvia Insights
Daily chart
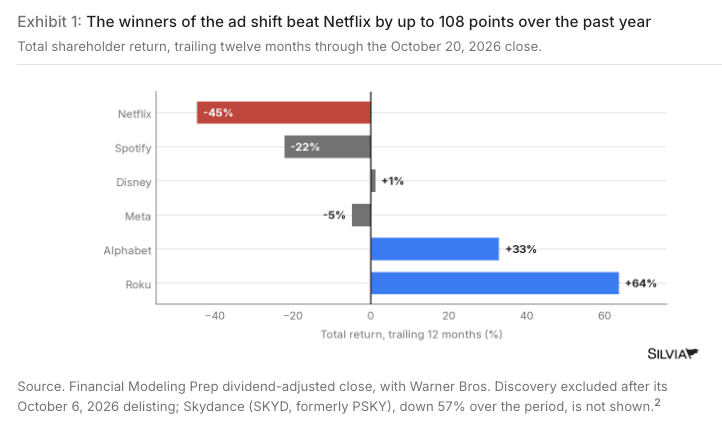
Roku returned 64% over the past year while Netflix lost 45%
Silvia Insights
Daily chart
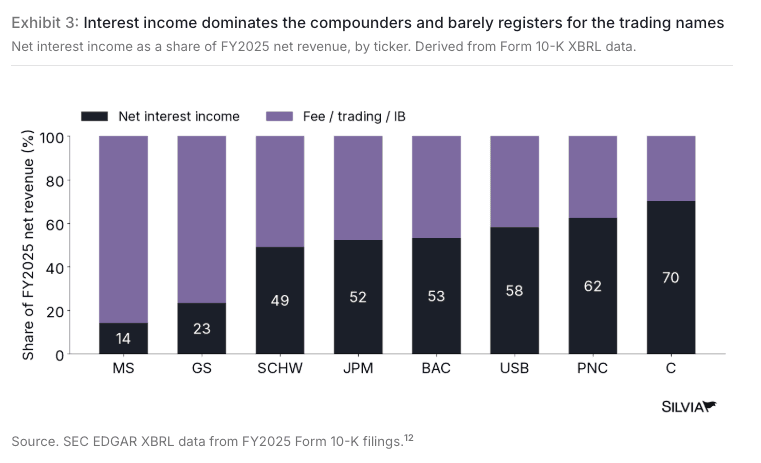
Citi gets 70% of its revenue from interest income while Morgan Stanley gets 14%
Silvia Insights
Daily chart
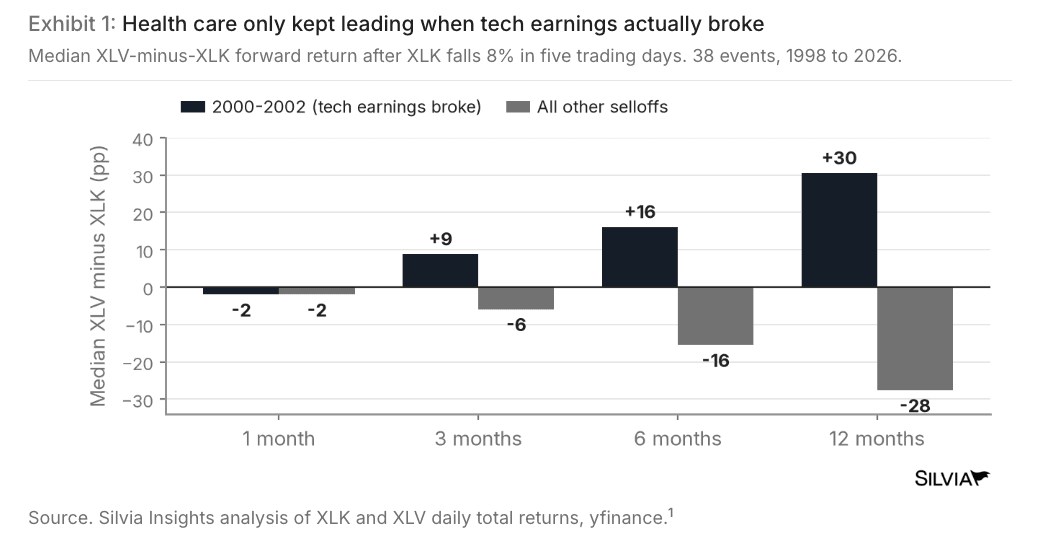
Health care only beat tech after selloffs when tech earnings broke
Silvia Insights
Daily chart
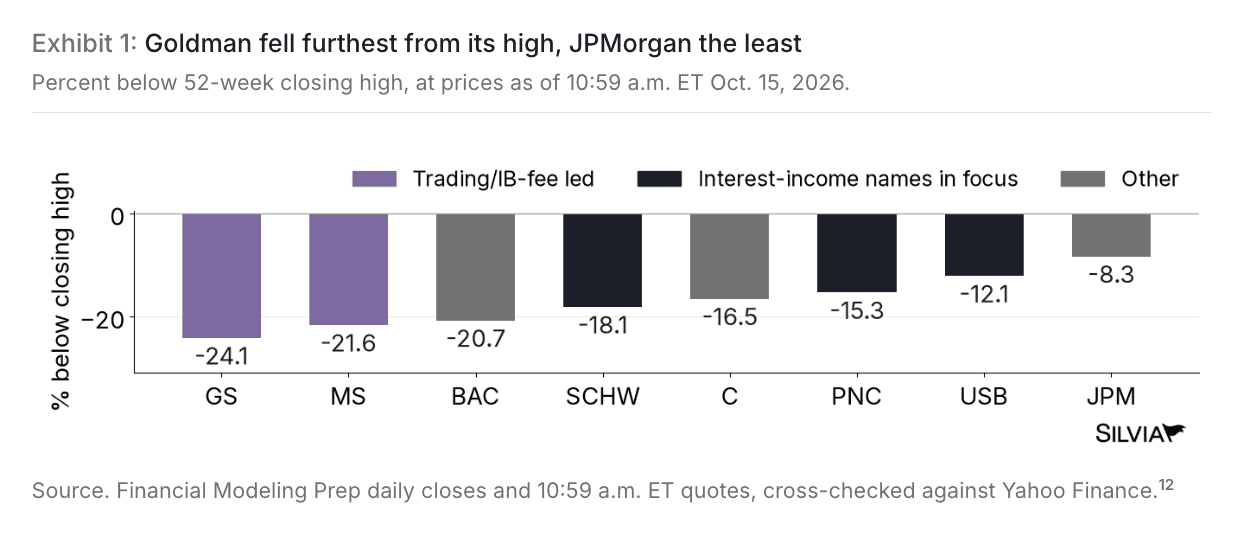
Goldman Sachs fell 24% from its record while JPMorgan gave up just 8%
Silvia Insights
Daily chart