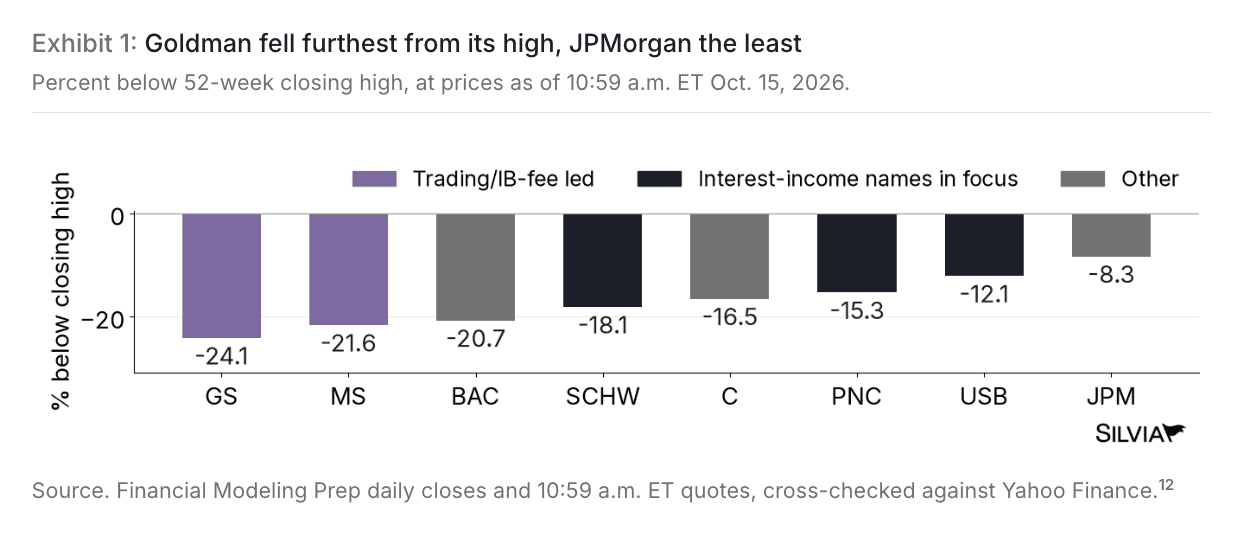
Goldman Sachs fell 24% from its record while JPMorgan gave up just 8%
Percent below 52-week closing high, at prices as of 10:59 a.m. ET Oct. 15, 2026
Silvia Insights research desk
Wall Street's trading houses took the worst of the bank selloff, and the largest bank in the group took the least.
On October 15, Goldman Sachs sat 24.1% below its July 15 record close and JPMorgan just 8.3% below its high.
Goldman then closed 24.0% below that record on October 19, its deepest close since April 2025.
Goldman and Morgan Stanley earn less than a quarter of their net revenue from net interest income, so their profits rise and fall with deals and trading.
From the October 15 close through October 19, the only two of the eight to gain were PNC and US Bancorp, the two regional lenders on the chart.
For now, investors want bank earnings they can predict.
This chart comes from a new Silvia Insights research report. Members received the full analysis last week, including the actionable trade ideas, risks and what comes next.
Research is for informational purposes and does not constitute personalized investment advice.
Get free research by email
Four daily chart analyses and one weekly report from the Silvia Insights desk.
Subscribe free