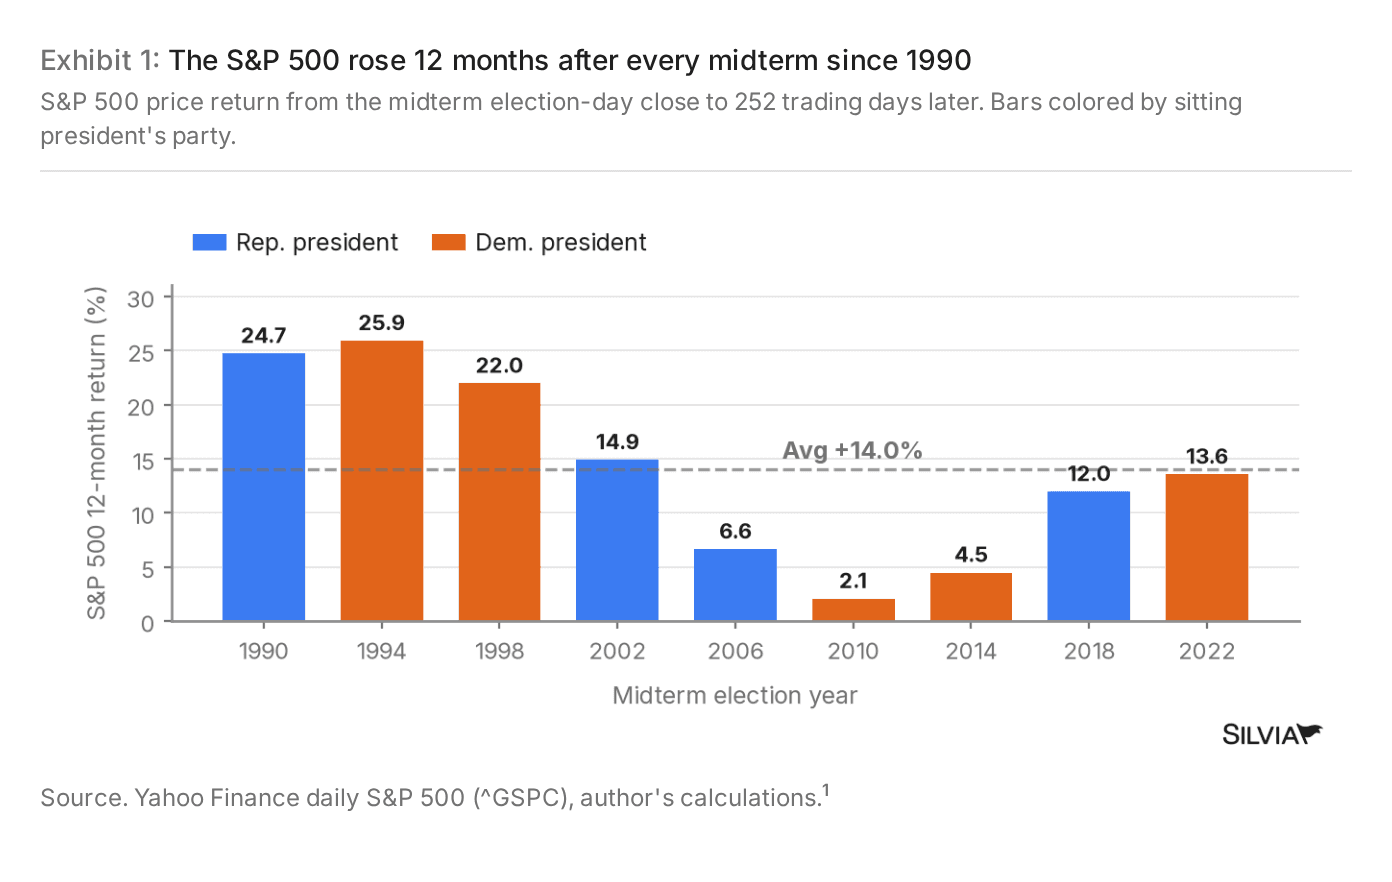
The S&P 500 has been higher a year after every midterm since 1990
S&P 500 price return from the midterm election-day close to 252 trading days later. Bars colored by sitting president's party
Silvia Insights research desk
It has barely mattered which party held the White House. Midterms under both delivered almost the same average gain.
Across the nine midterms from 1990 through 2022, the S&P 500 rose an average of 14.0 percent in the 12 months after election day. The weakest year followed 2010, a gain of 2.1 percent, and the best followed 1994, at 25.9 percent.
Under Republican presidents the average was 14.6 percent across four cycles, against 13.6 percent across five under Democrats. On November 4, the day after this year's vote, the index rose 1.6 percent to close at 7,688.62.
Nine cycles is a small sample, and none of them ended a year lower.
This chart comes from a new Silvia Insights research report. Members received the full analysis earlier this week, including the actionable trade ideas, risks and what comes next.
Research is for informational purposes and does not constitute personalized investment advice.
Get free research by email
Four daily chart analyses and one weekly report from the Silvia Insights desk.
Subscribe free