Retail investors are loaded up on stocks. Here's what the S&P 500 did next.
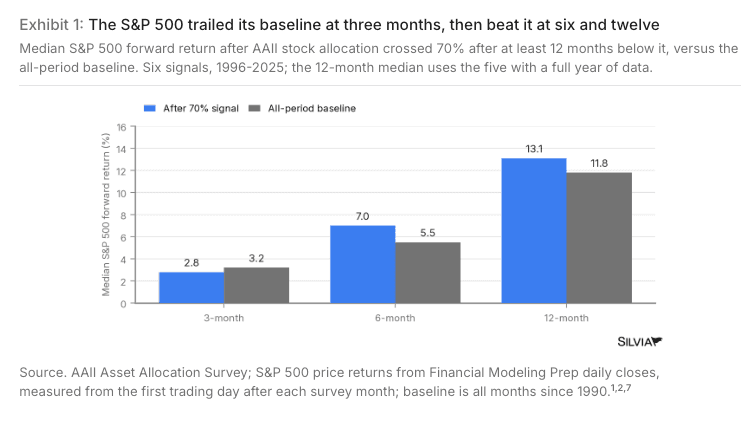
Median S&P 500 forward return after AAII stock allocation crossed 70% after at least 12 months below it, versus the all-period baseline. Six signals, 1996-2025; the 12-month median uses the five with a full year of data
Silvia Insights research desk
A stock-heavy crowd has meant a slow start, then a stronger six months.
Individual investors in AAII's monthly survey held 71.8% of their portfolios in stocks and stock funds in September, the highest since December 2017. After the six times that gauge crossed 70% following at least a year below it, the S&P 500's median gain was 7.0% over six months, above its typical 5.5%.
A year out, the median was 13.1% against a typical 11.8%. The weak spot was the first three months, a 2.8% median gain versus a typical 3.2%.
The median signal lagged at three months and led at six.
This chart comes from a new Silvia Insights research report. Members received the full analysis last week, including the actionable trade ideas, risks and what comes next.
Research is for informational purposes and does not constitute personalized investment advice.
Get free research by email
Four daily chart analyses and one weekly report from the Silvia Insights desk.
Subscribe free